The weather model GFS (Global Forecasting System) has, for years, teased weather anoraks with mouthwatering possibilities of what the weather could be like 5 to 10 days away. Many ‘coldies’, that unexplained breed of weather anorak whom lust after extreme cold and snow every winter, often look at the end of the run, out to 384 hours, and cherry pick these charts, taking as gospel that the synoptics will come to pass, especially if there is high pressure plonked over Scandinavia.
But 16 days is an eternity in weather forecasting and what happens on the day is, more often than not, a world away from what was modelled a fortnight before. But it doesn’t stop the blizzard of toys and dummies being thrown out of prams, often by grown men who really should know better that the weather they really want is always 10 days away.
Is this about to change? Probably not but the improved resolution, from 27km to 13km, will massively improve accuracy at short-range.
In the meantime it is perhaps ironic that the final 18z operational run of the GFS 27km resolution model had some of the most mouthwatering solutions for classic cold and snowy winter weather for nearly two years. But, just for a change, the operational is backed up by the ensemble.
Here are most of the 500hPa charts from that last run
Floods in Somerset have, up to now, seemed far removed from our own back yard. But with thousands of homes by the upper parts of the River Thames now at risk of flooding I wondered how safe we were from our own rivers.
A look back through the reference books show the geography of the Roding and Lea Valleys has made the area prone to inundations for hundreds of years.
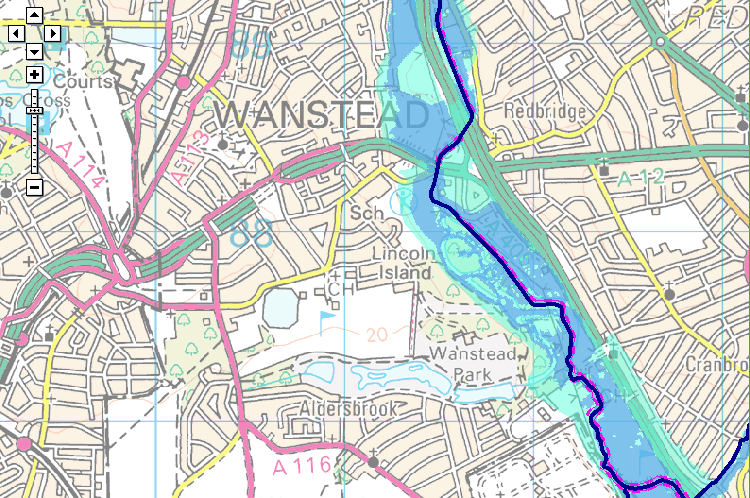
The Environment Agency’s Flood Map for Planning shows the flood zone risk of the area. And endorses Howard’s account that the river Lea was ‘a mile wide’ at its peak
In January 1809 the lower River Lea burst its banks in several places following a deluge that dumped two inches of rain in the space of 24 hours. The rain abruptly ended a snowy cold spell that had begun over a month before in the middle of December. From Luke Howard’s readings it is likely that up to half a metre of snow had fallen in the previous weeks in the upper parts of the surrounding countryside with only slight thawing. With the frozen ground unable to absorb any of the rapidly melting snow and rainfall the amount of water flowing downstream must have been immense. Howard takes up the story…
“The River Lea continued rising the whole of the 26th… The various channels by which it intersects this part of the country were united in one current above a mile in width which flowed with great impetuosity and did much damage.”
Howard, his chemical factory located on the banks of the river Lea close to what is now Bow flyover, wrote at length about the event, his account replacing the usual brief notes about daily weather in his book The Climate of London.
He talks of embanked pasture land being “filled to the depth of eight or nine feet” and people driven to their upper rooms relieved by boats plying under the windows.
The Environment Agency’s Flood Plan map of the Thames illustrates Howard’s comment that “the Thames was so full during this time that no tide was perceptible”
“The Thames was so full during this time that no tide was perceptible.” It took until February 23rd for things to return to normal.
Miraculously no lives were lost in the flood and cattle “by great exertions” were saved by being kept in their stalls. Howard, saying that the flood could have been far worse, believed a neap tide, strong westerly winds urging water down the Thames and mild weather helped avert a tragedy.
Howard’s statistics of the previous months show that the second half of 1808 were wetter than average – though not especially so. And nothing like the rainfall we have had this winter. From December 1st until February 8th Howard recorded 130mm of rain, which is about 100mm less than what I have recorded this winter.
This fact alone shows just how much the nature of the river has changed in the last 200-odd years thanks to spending on flood defences.
Work to improve the defences was prompted 67 years ago when similar catastrophic flooding came with the thaw that ended the severe winter of 1947, one of the coldest winters in recorded history and an episode remarkably similar to what Howard recorded in 1809.
Flood risk areas around the River Roding close to Wanstead are much smaller than the equivalent area in Lea Valley
The Lea Valley, along with many parts of the country, saw some of its worst flooding in a generation. The river burst its banks at several points bringing misery to surrounding communities. Valleys turned into lakes in 40 counties and East Anglia’s fens were a sandbagged inland sea. More than 100,000 properties were damaged and, then as now, heroic battles were fought by the military to keep water-pumping plants and power stations dry.
The sense of crisis was felt worldwide. Canada sent food parcels to stricken villages in Suffolk; the prime minister of Ontario even offered to help dish them out.
A marker of that flood, together with a history of flood defences, can be found here. There is also British Pathe footage of another flood between 1910 and 1919 here .
The River Lea Flood Relief Channel, that flows between Ware, Herts, and Stratford, took almost three decades to complete. The channel incorporates existing watercourses, lakes and new channels. Since it was completed in 1976, there have been no major flood events in the Lea Valley, although there have been three occasions when the river system was full virtually to its capacity: in 1987, 1993 and 2000. Since its completion, the level of protection afforded by the structure has declined, so that in some areas it offers 2 per cent protection, and in some, only 5 per cent protection. The Environment Agency published a strategic environmental assessment in 2008, which looked at ways to maintain the flood defences in the Lea Valley.
The water table appears to have come to the surface on Wanstead Flats
It remains to be seen whether we will see any flooding in Redbridge – a further 40mm of rain is forecast to fall up to Saturday morning. As well as the problem of rain there is also the issue of the water table which in the past week has risen to the surface in places. Inland lakes forming on Wanstead Flats have seen the cancellation of football fixtures and a couple of people I’ve spoken to say standing water has started to appear in their cellars
It is all too easy to blame the Environment Agency for the current flooding in Somerset and elsewhere but the meticulous planning by its forerunners brought, at least to date, an end to the widespread flooding problem in the Lea Valley.
As the government struggles to find a solution to the current problems with flooding it would do well to look to the grand schemes of the past and forget about any planned cuts to flood defences.
Much has been printed in the tabloids over the past month or so that we are in for a severe winter. Not a week goes by without the Daily Express splashing that the ‘Worst winter EVER is on the way’. Just this morning the same rag told us that three months of ‘exceptionally cold’ weather are due. On closer inspection the story elaborated the scene with quotes from James Madden of Exacta Weather, one of the ‘experts’ feeding these fantastical stories.
The Temple, Wanstead Park, always looks that much more stunning with a covering of snow
Quite how Mr Madden and other experts arrive at these forecasts is a bit of a mystery. The mystery has deepened further since I decided to crunch a few numbers and try to predict what is in store for the months ahead. Looking at data for this area stretching back over 130 years to 1881 I decided to calculate a seasonal average and arrived at a final figure using singularities – basically looking at the weather patterns we’ve had during October and November.
Many professionals would scoff at this method of pattern-matching, so I’ve incorporated a couple of other ‘now’ factors and taken on board current variables such as sea surface temperatures in the Atlantic and Pacific.
The figure I arrived at, taken as an average of the closest matching autumn periods, is a mean temperature of 4C with rainfall totalling 133mm over the months of December, January and February – that’s about a degree colder than average and 90% of average rainfall. The probability of a winter with a mean temperature of between 4C and 5C is 37% – the most likely outcome. With this in mind a winter in the form of 1986-87 is possible – though whether we would see the same extremes of temperature and snowfall that we experienced in January 1987 is open to question.
The Met Office, with all their computing power and expertise, seem to be hinting at something similar – ie slightly colder than normal. The opening couple of weeks to my forecast seem quite plausible, looking at tonight’s models. Look at the similarity in the synoptic charts for December 8th here.
Shoulder of Mutton pond, Wanstead Park
Over the last few years the snow lovers among us have been spoiled after a run of very mild winters during the late Nineties and early Noughties that prompted climate expert Dr David Viner to utter the immortal words that one day “children just aren’t going to know what snow is”. It was only a matter of a few years before the words from the senior research scientist at the University of East Anglia seemed a bit hollow.
Mark Twain, born this day in 1835 , once uttered the famous phrase: “Climate is what we expect; weather is what we get” – there is always a chance we could suddenly lurch back to milder winters. This winter could spring a surprise, be it very cold or very mild. But judging what’s happened over the last 130-odd years – a 1962/63 or a balmy 1989/90 look very unlikely.
* Forecasting models use probability on any given outcome. Millions of observations are fed into the Met Office database (and other countries’ weather agencies) every day. Supercomputers then crunch through this data to give probable outcomes. With the volatility of the atmosphere it is not surprising that certainty of any outcome often falls away rapidly. Forecasting has improved greatly in the last 20 years – though anything the models churn out beyond three to five days should be handled with caution. Long range models can give *some* idea of general trends for the months ahead – but changing just one variable can vastly alter an outcome at the end of the run.
* *Over the past few months I have been collating data for the area around Wanstead. This data is freely available from the excellent Met Office library and is emailed via Excel spreadsheet. Rainfall stats include a near-complete daily archive, stretching from 1961 to 2003, from City of London Cemetery . Sadly the rainfall station, along with many others, ceased to supply the Met Office after cuts were made shortly after the turn of century. Prior to 1961 I have used monthly figures taken at the Greenwich Royal Observatory stretching back to 1881. Though this is 6 miles away the difference in temperature between the two areas would be miniscule compared with rainfall data and so can be used. I use my own stats for the period after 2003.


You must be logged in to post a comment.