
The coming winter is likely to be mild and wet thanks to a predominant south-westerly Atlantic regime.
This year I have tried to improve my statistical method by using historic data from across the capital thanks to the Met Office’s ever expanding library of data; daily Kew values now date back to 1881!
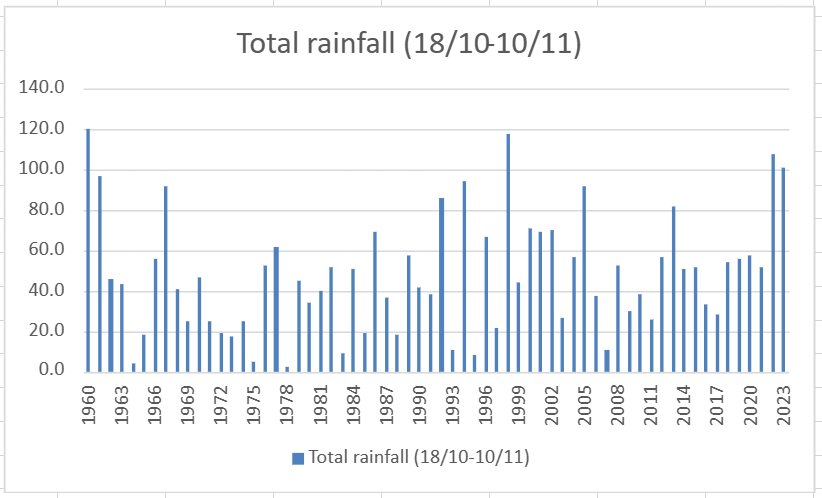
In terms of rainfall and mean temperature a total of eight years were similar to this October and November, spanning 1929 to 2020.
The probabilities for the following DJF winter were thus.
| Mean temperature | Probability | Rainfall | Probability |
| Very mild | 37% | Wet | 37% |
| Average to mild | 51% | Average | 63% |
| Below average | 12% | Dry | 0% |
Looking deeper into the stats I had a look at the Oceanic Niño Index; the most similar years to this one were 1982 and 1987.
A note on WeatherWeb mentions exception rainfall in the Lewes & Brighton area of Sussex, between 20th September and 31st December 1982.
January 1988 was the wettest in England and Wales for over 40 years, and the wettest at Hampstead since records began there in 1909.
February of that winter also saw a major storm affecting much of the British Isles on the 10th and 11th with much damage to buildings.
The prognosis for snow at this point seems bleak – though chances may be heightened should we experience a stratospheric sudden warming in December / January. Though, as seen in 1987 where a vortex ‘split’ was recorded, this would still not guarantee wintry weather.


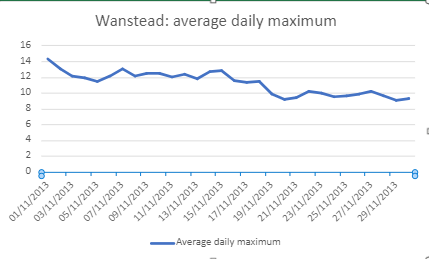
Taking the above years into account would give a winter where the average mean would follow this graph. Therefore, after the cold snap during the first week of December, the temperature gradually climbs through the month until the 18th when the will be a gradual drop for a possible cold snap between Christmas and New Year.
This then followed by the usual warm up in the new year with changeable weather through January. The best chance of a sustained cold snap appears to be from February 7th to 13th.


You must be logged in to post a comment.