I’ve been doing these written winter forecasts for five years now but this year I’ve never seen such a spread of probabilities as to how winter may pan out. So, if by the end of reading this you are none the wiser, you’re not alone!
The mean temperature for winter 2017/18 is looking average overall with average precipitation. While that doesn’t sound exciting for anyone looking for colder weather and snow I think the figures mask frequent 3 or 4 day-long cold snaps from the Arctic interspersed with milder interludes from Atlantic incursions; typical characteristics of a pattern driven by the troposphere. For anything longer term we have to hope for a warming of the stratosphere, a sudden stratospheric warming over the Arctic, that downwells into the troposphere, reversing the general westerly circulation. We are overdue an ‘SSW’ event but, even if one were to happen, its effects wouldn’t be felt until much later in the winter.
The current cold snap follows the recent disruption of the polar vortex. The ‘displaced polar vortex’ regime seems to be becoming more common as the Arctic gets warmer and maintains more open water during winter. This leads to anomalous ridging over the Arctic, which results in a displaced or bifurcated vortex, which leads to somewhere in midlatitude getting persistent anomalous cold. There was very cold air around last year but the UK missed out; the heart of the cold plunging down far to our east with snow falling on beaches in Crete!
This week’s cold snap looks like it will be short lived though the ‘displaced vortex’ could be an early sign of yet another pattern transition in the troposphere. Looking at the latest model output it is uncertain how long the next polar vortex perturbation will be.
So, whether we see any cold, snow-worthy, air this winter is a lottery – though I think our chances are a lot better than they have been for the past 5 years.
Because October and November have been so dry I’ve had very little to work with in terms of stats to try to find if the current pattern is similar to previous autumns. Instead I’ve looked in depth at ENSO, QBO and local meteorological data.
ENSO
The El Niño–Southern Oscillation (ENSO) is a periodic variation in winds and sea surface temperatures over the tropical eastern Pacific Ocean. It is forecast to be mildly negative (La Nina) over the coming winter. Many doubt whether it has an impact on our winter but there seems to be a connection with strong La Ninas and very mild winters. Because it is forecast to only be mildly negative it’s impact may be very small. I had a look at similar years were ENSO was -0.4 in September and came up with the following.

QBO
I also had a look the quasi-biennial oscillation (QBO), the quasiperiodic oscillation of the equatorial zonal wind between easterlies and westerlies in the tropical stratosphere. This produced the following table of probabilities.

Singularities / patterns
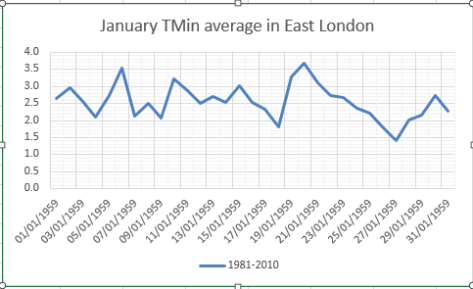
My traditional method of looking back for similar patterns of weather in the autumn produced this table.

So, considering all three tables together, would suggest, probably bizarrely given the cold start to this month, a rather mild December followed by an average January and February.


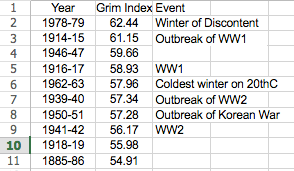 The grimmest winter, considering statistics back to 1881, was, ironically, the 1978-79


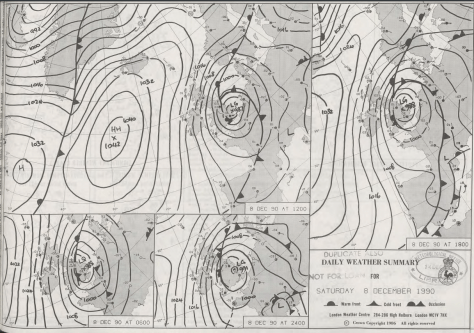
 “The snow did not freeze, however, but melted very rapidly during the next few days, as the temperature rose a little. By late on the 8th, many parts of the Midlands had 20cm or more of lying snow. Acocks Green, Birmingham, reported 42.5cm on the 8th. The Peak District had 38cm at Middleton and 25cm at Winksworth. Newcastle under Lyme reported 28cm, and many other places had more than 20cm. Drifts up to 60cm on motorways in the Derby area, and at Carlton in Coverdale, near Leyburn, a report of 240cm. Snowfall on the 9th in the Dorchester area in 1990 was the heaviest pre-Christmas fall in that area since 9 December 9th, 1967.”


You must be logged in to post a comment.