A blog that tries to make sense of how the UK's national climate translates into local weather for Wanstead and the surrounding regions of east London and west Essex.
Check out my twitter feed @wanstead_meteo for local weather forecasts, stats, records and phenomena for the east London areas of Wanstead, Aldersbrook, Leytonstone and Stratford. And anything else weather
I’ve been doing these written winter forecasts for five years now but this year I’ve never seen such a spread of probabilities as to how winter may pan out. So, if by the end of reading this you are none the wiser, you’re not alone!
The mean temperature for winter 2017/18 is looking average overall with average precipitation. While that doesn’t sound exciting for anyone looking for colder weather and snow I think the figures mask frequent 3 or 4 day-long cold snaps from the Arctic interspersed with milder interludes from Atlantic incursions; typical characteristics of a pattern driven by the troposphere. For anything longer term we have to hope for a warming of the stratosphere, a sudden stratospheric warming over the Arctic, that downwells into the troposphere, reversing the general westerly circulation. We are overdue an ‘SSW’ event but, even if one were to happen, its effects wouldn’t be felt until much later in the winter.
The current cold snap follows the recent disruption of the polar vortex. The ‘displaced polar vortex’ regime seems to be becoming more common as the Arctic gets warmer and maintains more open water during winter. This leads to anomalous ridging over the Arctic, which results in a displaced or bifurcated vortex, which leads to somewhere in midlatitude getting persistent anomalous cold. There was very cold air around last year but the UK missed out; the heart of the cold plunging down far to our east with snow falling on beaches in Crete!
This week’s cold snap looks like it will be short lived though the ‘displaced vortex’ could be an early sign of yet another pattern transition in the troposphere. Looking at the latest model output it is uncertain how long the next polar vortex perturbation will be.
So, whether we see any cold, snow-worthy, air this winter is a lottery – though I think our chances are a lot better than they have been for the past 5 years.
Because October and November have been so dry I’ve had very little to work with in terms of stats to try to find if the current pattern is similar to previous autumns. Instead I’ve looked in depth at ENSO, QBO and local meteorological data.
ENSO
The El Niño–Southern Oscillation (ENSO) is a periodic variation in winds and sea surface temperatures over the tropical eastern Pacific Ocean. It is forecast to be mildly negative (La Nina) over the coming winter. Many doubt whether it has an impact on our winter but there seems to be a connection with strong La Ninas and very mild winters. Because it is forecast to only be mildly negative it’s impact may be very small. I had a look at similar years were ENSO was -0.4 in September and came up with the following.
QBO
I also had a look the quasi-biennial oscillation (QBO), the quasiperiodic oscillation of the equatorial zonal wind between easterlies and westerlies in the tropical stratosphere. This produced the following table of probabilities.
Singularities / patterns
My traditional method of looking back for similar patterns of weather in the autumn produced this table.
So, considering all three tables together, would suggest, probably bizarrely given the cold start to this month, a rather mild December followed by an average January and February.
I’ve put together a few top 10s of stats for Wanstead, St James’s Park and Heathrow for the month of November.
Probably most notable is how the month in 2010 lurched from being so warm at the start to so cold three weeks later, setting up December to be one of the coldest on record.
Some national UK November values according to TORRO
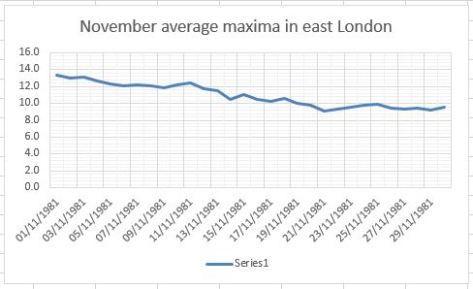
In terms of climatology November maxima, considering the 1981-2010 average, shows a steady fall until the 15th. And another steady fall to the 22nd before things level off. This would reflect the November singularities; St Martin’s Summer, between 15th and 21st, peaking on the 18th, occurs in 66 per cent of years. The Early December storms singularity can arrive this month, on the 24th, the air off the Atlantic raising the mean temperature.
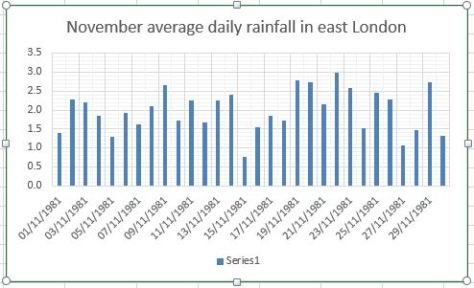
The average rainfall graphic shows that downpour amounts are variable through the month. A tendency for dry weather around the 15th reflects the St Martin’s Summer singularity.
This graphic shows the average 9am air pressure in November since 2013.
October 2017 was a very dry month. Just 12.6mm of rain were recorded, the driest October since 1995 and the 11th driest since 1797.
The monthly mean finished 13.1C, 1.3C above average and the seventh warmer than average month this year.
Some 81 hours of sunshine were recorded, 76 per cent of average – the 4th duller than average month in a row. Just three months have been sunnier than normal in 2017!
Air frosts: 0, Ground frosts: 2
The first half of November looks like it will be predominantly anticyclonic. Expect lots of calm weather with the usual frost and fog.
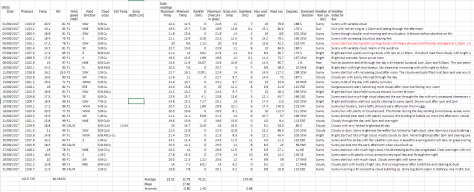
Here follows the full weather diary for October…Full stats for the month here:http://1drv.ms/1rSfT7Y
November normally marks the return of those autumn staples frost and fog and this December marks the 65th anniversary of the Great Smog.
Looking back through the archives the worst fogs tend to appear throughout these two months, set off by recurring weather patterns. The usual scenario, an anticyclone centred over Switzerland and Austria, leaves our part of the UK in a light SE’ly feed off the continent. Warm air aloft traps already poor quality air at ground level, the temperature inversion gradually leading to increasing levels of pollution.
During the Georgian Regency period fog occurs numerous times in Luke Howard’s Climate of London.
November 27th 1816 : “The atmosphere was so darkened yesterday morning in the vicinity of the metropolis by the thick fog combined with smoke that in some parts it appeared like a cloudy night. In the neighbourhood of Walworth and Camberwell it was so completely dark that some of the coachmen driving stages were obliged to get down and lead their horses with a lantern.” (Evening Mail)
December 31st 1817: “The fog of Wednesday (31st) seems to have been confined to the metropolis and the immediate vicinity. No further to the northward than the back of Euston Square the weather was clear and even bright. A gentleman who came to town from Enfield saw no fog till he approached London. Southward of London it extended as far as Clapham and it was rather thicker in some of the environs than in the metropolis itself. Upon an average 10ft was the distance at which objects became invisible out of doors. Within doors it was impossible to read without a candle.”
November 3rd 1820: “A very thick fog in the morning.”
And on the 18th: “An extremely thick fog which remained most of the morning. About 10am the coachmen on the road were unable to see the heads of their horses which in many instances were obliged to be led.”
In 1828 several days in November were noted for their fogginess, including 11th, 17th and 19th. The 12th had “extreme dense fog all day.”
“The fog of Wednesday (12th) has seldom been exceeded in opacity in the metropolis and its neighbourhood. It began to thicken very much about half past twelve o’clock from which time till near two the effect was most distressing making the eyes smart and almost suffocating those who were in the street, particularly asthmatic persons.
“In the city all the bankers and offices of different descriptions as well as the principal shops were obliged to have lights. To see with any distinctness further than across the street was impossible. All the narrow lanes beyond the perspective of a few yards were absolutely in a state of darkness and in the great thoroughfares the hallooing of coachmen and drivers to avoid each other seemingly issuing from the opaque mass in which they were enveloped was calculated to awaken all the caution of riders as well as of pedestrians who had to cross the streets.
“On the Thames as on land the tendency which fog has to enlarge distant objects was strikingly illustrated. The smallest vessels on their approach seemed magnified to thrice their usual dimensions. St Paul’s had a prodigious effect through the mist though neither that nor the Monument were visible above the height of the houses. This optical illusion is said to arise from the fog diminishing the brightness of objects and consequently suggesting a greater distance since while the visual angle remains the same the greater the distance the greater the real magnitude. It cleared off a little about a quarter past two but returned with all its density in the evening. (Public Ledger)
The following year 1829 saw a virtual repeat with wintry weather setting in at the end of the month. Fog was recorded on November2nd, 11th and 19th. On the20th the diary entry read: “hoar frost, foggy day and so thick at night as to prevent travelling,” before the weather turned colder on 24th: “a hoar frost, cloudy, a heavy fall of snow from 10pm through the night – 4 inches and upwards on the ground. 25th: a little more snow, thaw. 26th: thaw going on cloudy, very cold. 27th: very thick fog, drizzly.”
With coal being the primary source of heat and power for millions of Londoners the air during anticyclonic conditions would have been thick with acrid soot. The smell of coal in pea soupers, fogs caused by a mixture of soot, smoke and fog, is referred by a Mr Guppy in the letters page of The Times on December 5th 1837.
A London particular…
Not only was the darkness so great [in the morning] that the shops were all lighted up, but also every object in the streets, however near, was totally obscured from the view of the persons walking along. In Piccadilly the darkness was very great, and the confusion caused by the vehicles running against each other beyond description. About 9 o’clock the Hastings branch coach, which had just left the Old White Horse Cellar, while endeavouring to turn into St. James’s Street, ran into the shop window of Mr Hoby, the celebrated bootmaker, at the western corner, which it demolished with a fearful crash, breaking upwards of 40 squares of glass.
Fast forward 35 years, with the industrial revolution in full swing, a notable fog in December 1873 was described in The Medical Times and Gazetteas “one of the most disastrous this generation has known,” going on to point out that “to persons with cardiac and respiratory disease it has in numerous instances proved fatal.” Some 273 people died as a result of bronchitis caused by the coal-smoke saturated fog which enveloped the city for days.
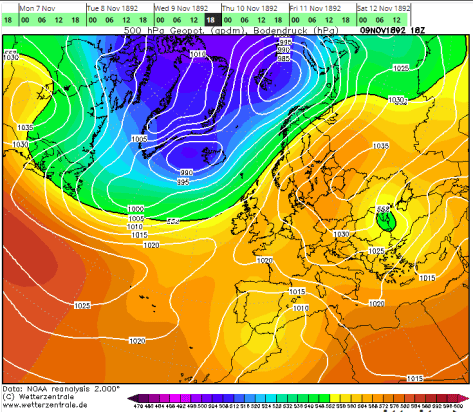
Reanalysis charts enable us to see how an anticyclone centred over Austria allowed ideal conditions for fog to form, the worst conditions probably being on November 9th 1873
With the population of London steadily increasing, together with ever higher demand for fossil fuels, the fogs grew steadily filthier. Throughout 1892, the letters pages of The Times were filled with complaints about the increasing number of fogs which slowed the metropolis to a crawl. Most were concerned with what could be done to either end the great scourge or to at least ameliorate the worst effects of the great seasonal nuisance.
By the autumn, the governor of the Gas Light and Coke Company was becoming tired of accusations that they were not supplying enough gas during fogs and pointed out that during a particularly foggy week in November, consumers used 60 million cubic feet of gas more than in the corresponding week a year earlier. Turning to the chief complainant, he suggested that his problem lay with his fittings “over which the company has no control” and went on to accuse him of “recklessly bring[ing] a baseless charge against this company.”
Conditions in November 1892 prompted many to write to The Times of London to complain about the ever increasing occurence of fog
And so it went on. But it would be another 60 years before the Great Smog, in December 1952 that led to at least 4,000 deaths and 100,000 being taken ill by the smog’s effects, finally brought about a wave of action that led to the Clean Air Act in 1956. The six days of the anticyclonic conditions are shown below.
How the Daily Express reported the ‘pea souper’ in 1952. Absolutely no need for any hype that plagues that paper’s weather stories today!
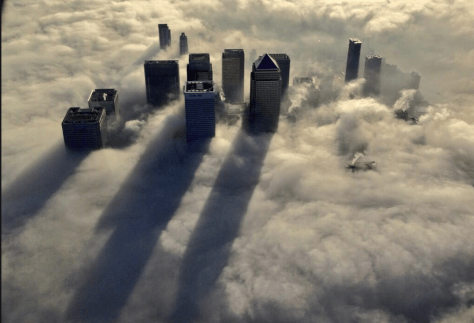
The anticyclones that caused these horrendous smogs still happen today. Since 2013 I have recorded 10 days of fog at 9am in the autumn / early winter seasons, including one in December 2013 that prompted the iconic image of Canary Wharf poking up through the gloom below.
Canary Wharf fog picture: Metropolitan Police helicopter takes stunning pictures of fogbound London from the sky | Metro News
Fog on November 1st 2015 was thick enough to see the annual firework display on Wanstead Flats cancelled.
With the advent of the Clean Air Act the often annual problem of smogs became a thing of the past though, over the past few years, pollution levels have been creeping up again. Campaign groups such as Clean Air in London seem at last to have a handle on the seriousness of the situation and that these 19th century weather patterns that brought such horrendous conditions still occur today. Indeed this table, drawn up by Xmetman, shows how common high pressure still is in winter.
It would be interesting to see how pollution today, in terms of total airborne particulates, NO2 etc, compares with pollution that Londoners had to suffer throughout the 19th and 20th centuries.
There is much anticipation in meteorological circles about the possible track of a deep depression spinning up the west coast of Ireland early next week.
The National Hurricane Center in Miami, on the 12Z GM run, puts Ireland and south-west England in the firing line of Ophelia.
The timing of the depression, coinciding with the 30th anniversary of the Great Storm, is remarkable and I wondered if there were other similar Atlantic storms through history.
A search through Martin Rowley’s excellent weather history site revealed that in October 1886, a small-scale but intense depression tracked ENE across central Ireland during the 15th, with lowest pressure estimated ~969mb.
The depression in October 1886 had a lowest pressure estimated ~969mb.
Gales, at least up to Storm Force 10, were reported by most ships and some coastal stations across the southern part of the British Isles, with ENE’ly gales across Scotland (north of the depression track). The low then moved slowly ESE to central-southern England (perhaps deepening a little) on the morning of the 16th, allowing N’ly gales (at least Storm 10) to affect the Hebrides.
Many trees were blown down across Ireland, the English Midlands and counties along the English Channel. Damage also occurred to standing crops, and the high winds were accompanied by heavy rain, which brought river flooding to England, Wales and Ireland, delaying the harvest, which was already compromised by the wet/windy weather. Some bridges were swept away.
October 14-15, 1881
Five years earlier, on October 14-15, 1881, an exceptionally severe gale (Force 9-10, locally Force 11) caused extensive damage across the British Isles & areas adjacent to the North Sea, especially along the north-east coast of England & across the eastern parts of the English Midlands.
Some 108 ships were reported missing. Inland, this gale was considered a ‘great storm’ with extensive loss of timber, especially in Scotland. One particular tragedy involved the destruction of almost the entire fishing fleet from the port of Eyemouth in Berwickshire.
The morning (14th) had been fine with near-calm wind. Some 41 vessels, mostly big deep-sea boats sailed out. In the middle of the day, the wind fell light, and then the storm struck suddenly. Nineteen of the boats were lost and 129 men failed to return to port.
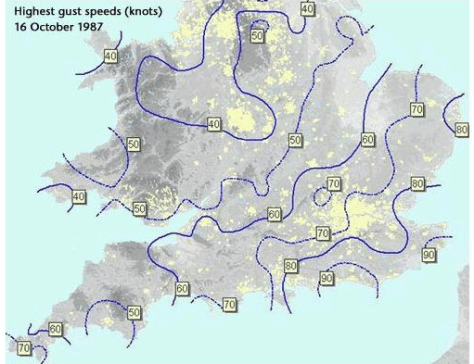
This month marks the 30th anniversary of the Great Storm. Some 18 people were killed as winds gusting to nearly 100mph affected London and the South East. Around 15 million trees were lost with Sevenoaks in Kent losing six of its seven historic trees.
Courtesy of the Met Office
The rapid development of ‘Low M’ took forecasters by surprise, the favoured outcome was for the low to move up through Brittany, remaining in or to the south of the English Channel.
I was living in a fairly sheltered corner of the London borough of Havering in 1987. I remember heavy rain just before midnight, around three hours before the storm reached its height, was heavy enough to send water trickling into my room, thanks to an overflowing roof valley. I thought it strange that Michael Fish hadn’t mentioned its severity in his lunchtime forecast.
I was awoken around 3.30am by a loud crash. Looking out the window I saw two dustbins flying down the road. You could sense each gust building in strength – the next dislodged a roof tile, sending it crashing on to the family car. By this point my mum and sister had awoken, my sister swearing she could feel the whole house moving: Mum ordered us downstairs. By this point the power had gone off and we sat listening to a small battery-operated transistor radio. We listened to updates from BBC Radio London where, like most other people, nobody knew what the hell was going on. The storm continued and first light gradually revealed the damage in the garden – a couple of trees over and next-door’s shed on its side; nothing compared to the rest of the region. But the disruption meant I didn’t attend school that day.
The storm was obviously a weather nut’s dream, and following so close on the heels of the coldest January I can remember. John Hall, of Surrey, can remember the storm well: “I’m not normally a very heavy sleeper, but I somehow managed to sleep through the worst of it (in Cranleigh, then as now).
“It was still windy when I woke around 7 am, but presumably not nearly as much as it had been earlier. By some miracle we still had mains power, and it was only when I switched on the radio and there was no sign of Radio 4 that I realised that something was up. (I assume the transmitter must have been damaged.) I walked the half-mile to the centre of the village to get my morning paper and then to catch the bus to Guildford station for my journey to work.
“It was only then that I learnt from the newsagent that there were no papers and wouldn’t be any buses, as every road in and out of the village was blocked by fallen trees. So I went home, switched on the TV and learnt all about what had happened.”
Dave Cornwell, of Laindon, south Essex, said: “Quite exciting but scary for me at home in Laindon. I awoke probably around 3.00 am to the sound of a metal dustbin lid (remember those?) flying down the street.
“Things sounded pretty bad and my sixth sense told me this was no ordinary windy night. I got up and looked outside and there was stuff flying by and lots of strange noises. One was my plastic gutter blown down and banging against the side of the house. I can’t be certain of the timings but we awakened our two young daughters and took them downstairs as I was worried as they slept in a room with a flat roof dormer window and there was a tall brick chimney stack directly above it. I heard more crashing sounds which unfortunately turned out to be a couple of roof tiles landing on my car roof which was parked in the drive. Of course with no internet then I did what a lot of people did and tuned into the police FM radio network. This gave me a better realisation that it was serious as they were describing the carnage on the roads and all of the emergency calls they and the fire brigade were getting.
“At about 5.30am I ventured out into my driveway to see if there was any serious damage but the storm was still raging and I can honestly say I couldn’t stand up and was unable to keep my balance so went back indoors. I think the wind speed was probably over 100mph at this point being funneled down the side of the house which runs south-north.
“By 8.00 o’clock I was getting ready for work and although by then people were being advised to stay at home I worked in a fairly essential service so thought I would give it a try. I managed to get to East London but there was debris everywhere and I saw a car completely crushed by a one of many trees that were blocking some side roads.
“Another thing I noticed that evening was my south facing windows had a layer of salt on them which must have been blown in from the south coast 60 miles away. It was a sight I’ll never forget and to this day I don’t like strong winds (had a scary flight at Heathrow in a severe gale as well) and always get a nervous feeling if I hear the wind getting up. Probably the most dangerous weather I have experienced anywhere in my lifetime.”
Much has been written about the storm, a ‘once in 500 year event’, including this summary by the Met Office. There is also an excellent paper by Bob Prichard published in Weather. The synoptic charts below show how Low M develops from 1200 on the 15th to 1800 on the 16th.
15OCT87 1200
15OCT87 1800
15OCT87 2400
16OCT87 0600
16OCT87 1200
16OCT87 1800
Because of widespread power cuts many television viewers didn’t see this recording of ITV’s Good Morning Britain at the time of transmission. A round up of the immediate aftermath of the storm, including comments from Jack Scott, can be seen in this edition of Thames News.
The following Daily Weather Report was published by the London Weather Centre:
An intense, and almost certainly exceptional, depression crossed the coast of south Devon soon after midnight, moving quickly, and deepening rapidly, with a track across the Midlands and out towards the Humber Estuary, leaving the United Kingdom land area around 0700 hours.
Some very severe conditions due to storm force winds were generated around the southern and eastern flank of the low, with gusts from approximately 0200 hours well in excess of 70 knots, and reaching a peak in the period 0300 hours to 0700 hours, with gusts to 90 knots reported from Herstmonceux and St Catherine’s Point in the early hours, and similar value gusts from the Channel Islands. The very stormy conditions were accompanied by some heavy rain, this rain pushing into Scotland and parts of Northern Ireland after dawn.
Clearer weather, on westerly winds, swept across southern Britain, pushing the worst of the stormy winds away into the North Sea. During the afternoon the country settled down to a blustery westerly with some heavy and thundery showers developing in clusters, running especially into western and southern coastal regions and parts of southeast England.
Across Scotland and northern England the skies remained cloudy, with outbreaks of mostly light rain, but troughs enhanced the showers in the northwest later in the evening with heavy rain. It was a rather cold day in most places, although the temperatures were near normal in the southeast.
The storm remains the most severe I have experienced in this part of the UK. The Burns’ Day storm in 1990 brought severe gale force winds in the London area but the low pressure was centred much further north.
The most recent severe windstorm in the London area, the St Jude Day storm of 2013, brought strong winds but nothing on a par with 1987.
15OCT87 2400
25JAN90 1200
28OCT13 0000
The anniversary of the storm, complete with a question and answer session attended by Michael Fish, will be marked at the Royal Met Society’s WeatherLive event in November.
The first month of autumn continued in the same vein as the last month of summer .
The mean temperature finished 14.8C, 0.6C below average and very similar overall to September 2013.
Some 53.5mm of rainfall was recorded, 103% of the 1981-2010 average. Some 114 hours of sunshine were recorded, 81 per cent of average, so on the dull side.
Overall the month was typical for early autumn – though possibly felt more autumnal because it was around 3C cooler than September 2016 and much wetter and duller than that month.
As usual at this time of year there is already much speculation about how cold the coming winter may, or may not, be. Winter has arrived over Siberia and early season snow cover is predicted to increase over the next week. However, the factor of early snow over Siberia being a sign of a cold winter to come in NW Europe is is only one piece of the jigsaw and I have seen it proved wrong a few times.
Snow cover: 2/10/2017
Modelled snow cover: 9/10/2017
Summary for September 2017
Temperature (°C):
Mean (1 minute) 14.4
Mean (min+max) 14.8
Mean Minimum 10.7
Mean Maximum 18.9
Minimum 5.3 day 21
Maximum 22.7 day 04
Highest Minimum 16.7 day 04
Lowest Maximum 15.2 day 19
Air frosts 0
Rainfall (mm):
Total for month 53.5
Wettest day 16.1 day 27
High rain rate 16.1 day 13
Rain days 19
Dry days 11
Wind (mph):
Highest Gust 28.9 day 12
Average Speed 2.3
Wind Run 1670.8 miles
Gale days 0
Pressure (mb):
Maximum 1022.7 day 01
Minimum 989.1 day 12
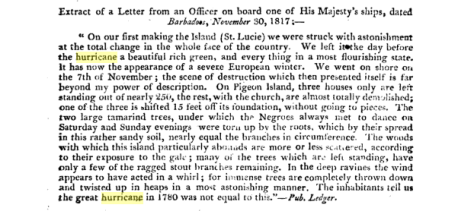
Two hundred years ago this autumn a devastating hurricane ripped through the Caribbean. Thousands lost their lives as the winds destroyed hundreds of homes, ships and sugar plantations.
An account in Luke Howard’s The Climate of London reports the loss of 1,800 lives in Martinique alone during the storm that was the most destructive in at least 37 years.
One extract from a ship’s officer on November 30th, 1817, reports on the devastation seen on St Lucia: “We were struck with astonishment at the total change in the whole face of the country.
“We left it the day before the hurricane a beautiful rich green and every thing in a most flourishing state. It has now the appearance of a severe European winter. We went on shore of the 7th of November the scene of destruction which then presented itself is far beyond my power of description.
“On Pigeon Island three houses only are left standing out of nearly 259 the rest with the church are almost totally demolished.”
Summer 2017 was a season of two halves, the mean temperature of 18.5C (1.3C above average) made it the tenth warmest summer since 1797.
Though it was warm overall it was also wet. Nearly 234mm of rain were collected, 159 per cent of average, making it the wettest summer since 1987.
Just under 535 hours of sun were recorded, 94 per cent of average and the sunniest summer for three years.
The graph of the mean temperature for the 3 months shows a marked decline from the second week of JulyThere were at least 3 falls of rain greater than 30mm over 24 hours though classic thunderstorms of recent years were notably lackingSunshine was broadly average


You must be logged in to post a comment.