London’s hottest heatwaves under the microscope

It is no surprise that London’s heatwaves are getting hotter but by what rate are they increasing?

Using a list of hot spells made nine years ago I set out to find how the 30-year trends have moved through the decades since 1852.

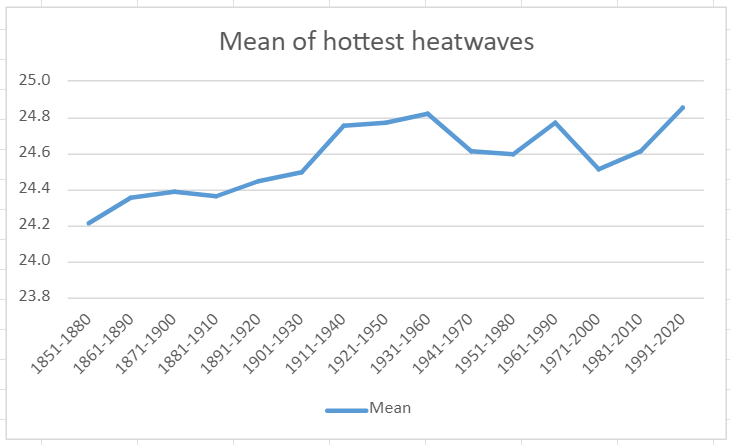
The mean of these hot spells has increased from 24.2C in 1851-1880 to 24.9 in 1991-2020, an increase of 0.7C.

Maxima during these spells, on the other hand, has decreased from 32.6C to 31.8C. It should be noted that the spell that produced this area’s hottest ever daily maximum, 40.1C on July 19th 2022, was a 2-day affair that didn’t qualify for the list.

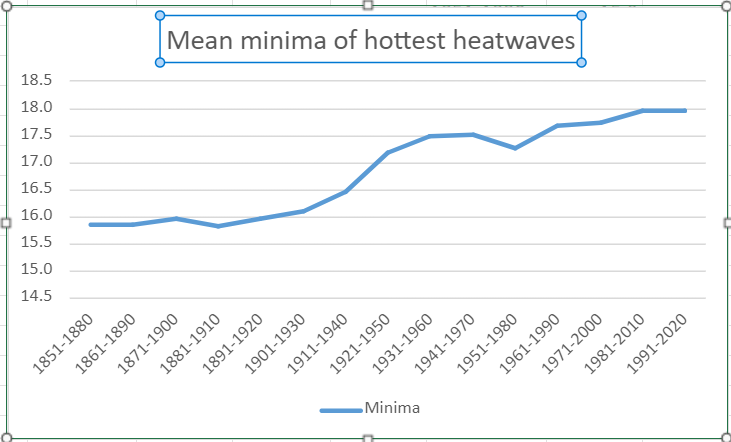
It is the minima that produces the most notable results with average low temperatures increasing over 2C from 15.9C to 18C! The urban heat island in full effect although the estate where a large proportion of these stats are gathered has changed little since it was built in the early 1900s.

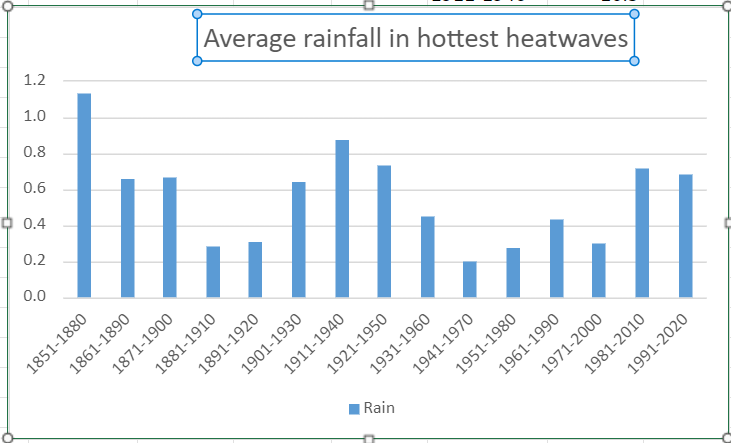
Rainfall during these hottest heatwaves is cyclical, in keeping with daily rainfall patterns observed over the same period.

Average sunshine in these heatwaves has shown a slight decline. It is no coincidence that maxima was at its highest during 1911-1950 when there was most sun. Increased cloud cover overall would take the edge off maxima while making the nights warmer.

Wanstead maxima: 1990 v 2024

The average maxima in Wanstead so far this summer is 22C, some 0.8C higher than in 1990 – the year an August heatwave saw the UK’s max record broken with 37C in Cheltenham. Media at the time said: “I wonder if the UK will ever see 100F?

The temperature in Wanstead on August 3rd reached 35.8C, my station notes for the day say: ‘dry, sunny and very, very hot’.

Will we see a similar heatwave next month? The weather models tonight suggest not, a flat westerly flow keeping any extreme heat in Iberia.

However, in keeping with summers that occur after an El Nino event, the core of any heat usually happens in late summer – August into September.

El Niño’s effect on local climate

With the El Niño–Southern Oscillation (ENSO) trending toward neutral I thought it would be interesting to see how east London’s climate has been affected over the past year.

Using the 12-month rolling mean for this station the difference is an increase of 0.24C. The increase in rainfall, using the 12-month rolling average, is more stark with an increase of 100.9mm.

I had a look at all other El Nino events back to the early 1960s. Some 5 of 7 events saw an increase in the rolling average mean.

The 12-month rolling average rainfall similarly saw an increase in 5 of the 7 events.

The most notable event was May 1997 to May 1998 which saw the temperature increase by 1.67C and a massive increase in rainfall of nearly 300mm.

June 2024 in Wanstead

The mean for June in east London was 16.2C, 0.2C warmer than average though the coolest 6th month for 11 years. So yet another warm month – it is now 18 months since we saw a below average one.

Rainfall was on the low side, just 15mm was 29% of average, the driest June for 6 years and 20th driest locally since 1797. Today also moves us into meteorological drought territory – 15 days since there was last measurable rain (>0.2mm)

Sunshine at 204.6hrs was 115% of average, the dullest for 3 years.

The most notable day was probably the 15th with thunder and lightning and a heavy shower at 1230-1300. Further moderate showers in the afternoon.

So, far from being the ‘crap summer’ some are portraying it summer 2024 so far is pretty average here.

More of the same for July. Perhaps a couple of hot days but any prolonged heat staying to our south?

As thought months ago with ENSO moving toward neutral August should be the month with the best chance of any heat records being broken?

Here’s a few extremes for the month of July across the capital.

Ode to the Derry

Pinewoods thin and it’s curtain up
On the stage of the Glen Derry. 
I stop and stare and raise the cup. 
Of tea mixed with some blackberry. 
The grand old Lodge sits to the left. 
And over there; Luibeg bereft. 

Of human settlers, long since passed. 
These actors of spirit and endeavour. 
Bob Scott and co, a solid cast.
Lost in time and gone forever. 
Sublime silence there is no lack. 
But in’t background the Lui soundtrack. 

Exit stage right there is a bridge. 
That leads through trees and up the glen. 
An escape from the summer midge. 
A path to the Macdui Ben. 
But it is here that one must stay.  
And watch this scene unfold today. 

A ray of sun spotlights Luibeg.
Prompting the ghosts o’ the Derry. 
A perfect script with nothing said. 
No need for lines, no words nary. 
Exit stage left, encore begins.  
It’s back to the Linn of Dee. Fins  

Looking across to Luibeg
Bob Scott o’the Derry. This photo hangs in the Bob Scott’s Bothy

Turfed out

Grass roots left for councils to grab,
into darkness is nature plunged.
By acres of green plastic drab, 
of reason, we are now expunged.
But this is what the people want, 
of climate we are nonchalant.

Warnings are for other people,
yet last year floods claimed your garage.
Memories lost, in discharge faecal,
not long before the next barrage.
Clues are in that relentless march 
of CET upwards, landscapes parch.

On we go, no time for nature,
let us now pave over that drive.
Flat Earthers all, blind to danger 
of the abyss, we’re doomed to dive.
Fear not we’ll scrub the atmosphere.
Of carbon dioxide from air near.

Fly away we must on breaks grand,
Worry about climate later.
Holiday firms need that demand, 
from the poles to the equator.
But it’s home, our backyards we need
to restore nature, not concede.

UK rainfall: Seathwaite / Honister v London

It’s been a wet winter so far. Some 177mm has fallen in Wanstead – already 122 per cent more what falls in an average winter.

But the amount pales into comparison with the Lake District. Since December 1st 1360mm has fallen at Honister, a station close to Seathwaite which proudly proclaims itself as ‘England’s wettest place’.

Over a calendar year the area usually sees 5.6 times the amount of rainfall of London. However, this winter the total of 1360mm makes it 7.7 times wetter! A testament to just how persistent the SW’ly airstreams have been this season. And a reminder that the Lake District is the called the Lake District for a reason.

Data from the excellent Starlings Roost Weather.

Wanstead weather in December

Continuing on from last month this blog focuses on the weather recorded at this station over the last 11 years.

A look at the twelfth month shows some interesting trends…

The 9am air pressure readings were not included in previous climate summaries owing to analogue barometers only giving approximate air pressure readings. The advent of AWS has changed that, particularly for independent amateur observers.

A look at the below graphic shows pressure falling through the first half of the month. A sharp rise is then seen before falling again – there’s often storms around the 23rd until the 27th.

Average daily windrun is how much wind there’s been during a 24 hour period. The 23rd comes out as windiest.

Average rainfall shows precipitation building through the month, to peak on the 23rd before a sharp drop off after the 27th.

Average daily maximum temperatures during December show a stuttering first 10 days before a steady rise through the next fortnight before a steady fall off from the 23rd .

Average daily minima is up and down in the first 10 days before a steady rise from the 11th. Again there’s that falling off a cliff on the 23rd.
This pivotal date, being so close to Christmas Day, is one of the reasons why ‘will it, won’t it be a white Christmas’ is a perennial fascination among the nation.

Advertisements

London winter forecast 2023/24

The coming winter is likely to be mild and wet thanks to a predominant south-westerly Atlantic regime.

This year I have tried to improve my statistical method by using historic data from across the capital thanks to the Met Office’s ever expanding library of data; daily Kew values now date back to 1881!

In terms of rainfall and mean temperature a total of eight years were similar to this October and November, spanning 1929 to 2020.

The probabilities for the following DJF winter were thus.

Mean temperatureProbabilityRainfallProbability
Very mild37%Wet37%
Average to mild51%Average63%
Below average12%Dry0%
London winter forecast 2023/24

Looking deeper into the stats I had a look at the Oceanic Niño Index; the most similar years to this one were 1982 and 1987.

A note on WeatherWeb mentions exception rainfall in the Lewes & Brighton area of Sussex, between 20th September and 31st December 1982.

January 1988 was the wettest in England and Wales for over 40 years, and the wettest at Hampstead since records began there in 1909.

February of that winter also saw a major storm affecting much of the British Isles on the 10th and 11th with much damage to buildings.

The prognosis for snow at this point seems bleak – though chances may be heightened should we experience a stratospheric sudden warming in December / January. Though, as seen in 1987 where a vortex ‘split’ was recorded, this would still not guarantee wintry weather.

Taking the above years into account would give a winter where the average mean would follow this graph. Therefore, after the cold snap during the first week of December, the temperature gradually climbs through the month until the 18th when the will be a gradual drop for a possible cold snap between Christmas and New Year.

This then followed by the usual warm up in the new year with changeable weather through January. The best chance of a sustained cold snap appears to be from February 7th to 13th.

Disturbed autumn regimes

October 18th this year heralded a run of weather where it has hardly stopped raining in this part of the south-east.

Since that date there has been 101mm of rain with 22 ‘rain days’, 24 hour periods where there’s been 0.2mm of rain or more. Just one of the last 24 days has been completely dry.

In terms of the 1991-2020 average the amount represents just under twice the usual amount of rainfall at this time of year.

In terms of unusual weather patterns it is up there amongst the ‘top 10’.

What does it mean for the coming winter. Impossible to say on a small scale but I’m guessing wet and mild in the south. Note however that 1960/61 and 1998/99 had a number of maritime northerly outbreaks which added up to an average winter in Scotland, and plenty of snow for the Highlands.

Also note how similar this autumn is to last year when the snowy spell in December came out of nowhere.

Meteorology-based musings about east London and beyond