I spent last weekend in the Lake District, on Saturday ascending both Scafell and the Pike, England’s two highest mountains.
The 964m Scafell, though lower than the Pike, is a much more technical ascent with hard to negotiate gullies, among them Lord’s Rake, where I discovered three lumps of icy snow. My findings, that I later Tweeted, attracted the attention of Iain Cameron, who, with a team of volunteers, maps and measures all British snow patches that survive through the summer.
I’ve read about Iain’s findings in the Royal Meteorological Society‘s journal Weather but to find one of these surviving patches myself enabled me to empathise just why he and others find the task of mapping and measuring them fascinating, a sort of first-hand insight into how the UK’s climate varies from year to year.
On descending from Scafell I thought I’d seen further patches lower down but these turned out to be melted puddles on the moorland that were reflecting white against the bright sky.
It was a cracking weekend weatherwise. Though the wind on Sunday was fairly brisk at the top of Hellvellyn it didn’t impact much on the conditions. Two dry days in a row with excellent visibility are rare at any time of year in the Lakes. I can’t wait to return.
Lack of rainfall and a broken pump have been cited by City of London Corporation as the main reason for the shocking levels of the ponds through the park.
The Ornamental Water by the Grotto is virtually dry. Images courtesy of Ralph Potter
The plight of the water courses has been well documented of late; a press release from the Corporation explains the catalogue of issues hampering efforts to address the problem. Closer scrutiny of these reasons, however, suggest that too much is being blamed on the weather.
A study of local rainfall back to 1981 suggests that though the ground water replenishing season (October 1st – April 24th) has been dry it is by no means out of the ordinary.
As you can see from the graph the rainfall here has gone up and down like a yo-yo and 2016-17 is only the fourth driest period: 1991-92, 1995-96, 1996-97 and 2011-12 were drier.
The Corporation’s press release states: “2015-16 was a helpfully wet period for us…”
Wrong. 2015-16 was average. And if you consider annual rainfall 2015 saw 92 per cent of average rainfall recorded; 2016 was 93 per cent – placing 58th and 66th in driest years since 1797. Nothing out of the ordinary.
“2016-17 has, however, been an especially dry period with below average rainfall since Spring 2016.”
Wrong. See above detail. There have been three drier periods since 1981. And since March 2016, only half of the months have been notably dry, a period that included the third wettest June since 1797.
“January to March 2017 has seen roughly 50% less rainfall than average”
Wrong. January to March rainfall was 94% of the 1981-2010 average
April has been dry, and could be among the top 5 driest back to 1797, but it seems the Corporation are trying to blame nature instead of years of neglect on their part.
The past months have seen much of Heronry Pond dry out. Image by Ralph Potter
The situation is in stark contrast to CoL’s other open space, Hampstead Heath, which has recently seen the completion of a £23m project to make safe the ponds there. CoL has deep pockets yet they have dithered for years over spending £25,000 to renovate the Coronation Bridge – and offer the people of Ilford a route into the park.
Figures released by CoL show it has only invested £1.23m in Wanstead Park over the last five years, compared with £50m spent in Hampstead Heath.
We are constantly told that problems in the park are ‘in hand’ yet progress on anything is painfully slow – and action to repair the pump has sadly come too late for much of the wildlife on Heronry Pond.
People from far and wide use Wanstead Park – they really deserve better!
You can view City of London Corporation’s press release here
Earthquakes in Italy and early season snow cover in Siberia have been well documented in 2016.
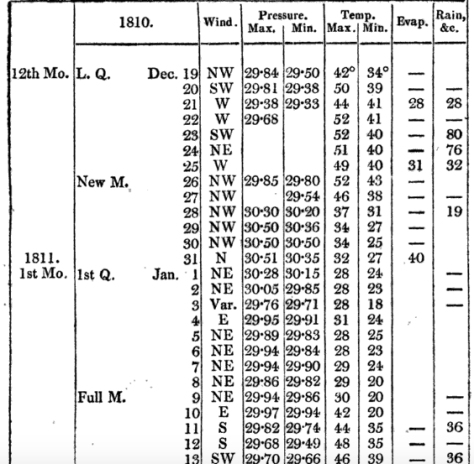
They were also mentioned by Luke Howard in his publication The Climate of London in 1810.
He also mentions winter thunderstorms over the Yuletide period, from Christmas Eve to Boxing Day – the amount of rain overflowing the Thames.
24th: Very windy night with heavy rain. 25th: Wind high all day with rain frequent lightning in the evening from SE. 26th: Wind very boisterous early in the morning day fine the rain of the last three or four days being impeded in its passage to the Thames by the spring tides overflowed the banks and filled the marshes.
Within two days of this wild and wet spell, complete with strong north-westerlies, the wind swung north and then north-easterly to usher in 1811 with a 12-day cold spell.
The conditions of the cold spell were not severe, the coldest night was -8C, it was a pretty standard cold spell for the time and one that the south-east used to experience with fair regularity in the early to mid 1980s.
Models currently show a (fairly) narrow chance of a stormy Christmas period. It would be interesting if it were followed with a cold spell in January – just like the ones we used to get in 1980s.
* The Booty website also contains the following on that notable month…
What is thought to be Britain’s strongest tornado occurred in December 1810. A category of “T8” (on a ten-point scale) occurred on the 14th at Old Portsmouth. The TORRO website says it: “tracked from Old Portsmouth to Southsea Common causing immense damage – although no deaths, it is believed. Some houses completely levelled and many others were so badly damaged that they had to be demolished; chimneys were blown down and the lead on a bank roof was ‘rolled up like a piece of canvas and blown from its situation’.”
Last month was the second warmest September in a local record going back to 1797! The monthly mean finished 17.8C, 2.4C above average. Despite being an ‘autumn’ month September was actually a full degree warmer than June!
September 2016 was the second warmest in a local record back to 1797, though we’re talking by fewer than tenths of a degree.
The hottest September day since 1959 was recorded on the 13th when 33.1C was reached, the sixth equal hottest in the local daily record back to 1848.
The month also saw the warmest minimum recorded since 1959 when the mercury failed to fall below 18.7C on the 6th.
It was another very dry month, the third much drier than average month in a row: just 27.7mm fell, 24 per cent of average, making it the driest September since since 2007 and the 12th driest in the local record.
Like August, the month only falls down in terms of impressiveness when sunshine hours are considered. Some 119 hours were recorded, that’s 85 per cent of average, making it the dullest September for 15 years.
Air frosts: 0, Ground frosts: 0
So what has September got in store weatherwise? The models on the 1st suggest that a large Scandinavian high will become established to our NE bringing lots of settled weather and showers on coasts. There’s obviously the chance of trough disruption as the month progresses if the anticyclone’s influence declines.
Beyond the grasp of the models my usual long range outlook method falls down this month due to September’s warmth and dryness – there is nothing within +/- 10% of September’s statistics. I would guess, however, that we are looking at another drier than average month with frost becoming a risk as the month progresses where skies clear. There is also the chance of more pleasant autumn days where skies are clear during the day.
My September outlook for temperature was poor. I predicted a mean of 15.3C (outcome: 17.8C). It was much, much drier than I thought: 300mm (outcome: 27.7mm). Sunshine was poor: 140 hours (outcome: 119 hours).
Here follows the full weather diary for September…Full stats for the month here:http://1drv.ms/1rSfT7Y
1st: Sunny start but cloud gradually increased until it was overcast by 6pm. Clear spells overnight but warmer than previous nights.
2nd: Cloudy though some brighter intervals.
3rd: Sunny start, cloud began to pile in at 12.30pm with rain arriving at 5.30pm, this fell through the evening with some showers in the early hours.
4th: Bright, breezy start but rapidly turning cloudy and dull. Some rain overnight.
5th: Light rain and dull to start – this quickly clearing to cloud by 3pm. Things remained cloudy with a muggy night.
6th: Cloudy, dull and muggy start after warmest September night on record. Another warm night though muggy.
7th: Cloudy to 11am though sun breaking through as drier air arrived. Feeling humid.
8th: Sunny start but with plenty of cumulus, this quickly decreasing to leave clear sky.
9th: Cloudy morning though sky seemed to periodically clear of low cumulus before becoming overcast and very breezy in the afternoon. Some rain overnight and just before obs time.
10th: Cloudy start with patchy light rain, this briefly turning heavy at 1pm before turning occasionally moderate. Dreadful afternoon after recently. Clearing overnight to leave a sunny start.
11th: A glorious sunny day with only the odd patch of cirrus.
12th: Bright start with some sunshine, clouding over with a few splodges of rain with warm front. Then sunny and very warm.
13th: Sunny start with a few cirrus and castalanus around. Breezy at times with the thermals. The warmest September day since 1959 and 6th equal warmest since 1848.
14th: Sunny start with a few cirrus. A few patches of alto-cumulus later. Very warm but not as hot as yesterday. Warm, pleasant evening. 15th: Sunny with a few wispy cumulus, clearing to hot sunshine. Some alto-cumulus developed at 2pm and towering cumulus could be seen in distance. Thunderstorms reporting to NW of London. Cloudy and warm overnight with eight peals of thunder in the early hours and heavy rain.
16th: Light to moderate rain through the morning, petering out at 1.30pm.
17th: Cloudy, cool and breezy all day, at times dull.
18th: Cloudy all day, a bit warmer than the previous two days.
19th: Cloudy start though with sun breaking through briefly at 11am until 1pm then cloudy again. Rain at 1am that didn’t last long enough to register.
20th: Cloudy and fairly calm – a nothing day with odd very light drizzle.
21st: Bright start with cloud breaking to long spells of sunshine before more cloud moved in. Warmer than of late.
22nd: Cloudy but sun broke through giving pleasant afternoon and cool overnight.
23rd: Sunny, gin clear and cold start. Just a few fair weather cumulus through the day.
24th: Sunny start with cloud decreasing. Very warm in sun but cloud and breeze built through the day. Overnight light rain between 6am and 9am.
25th: Bright start after overnight light rain.
26th: Bright start with a few cloud breaks here and there. Heavy shower at 12.15pm with further threat of rain but stayed dry.
27th: Bright start with signs of a cold front moving in from south then cloudy.
28th: Sunny start with patchy cirrus, this tending to thicken at lunchtime to turn mostly overcast with humidity increasing. Breeze also picked up with reappearance of sun mid afternoon. Cloudy, very mild and breezy rest of the day.
29th: Cold front and brief heavy rain swept in at 10.03am. Then intermittent falls until 11.23am.
30th: Sunny, gin-clear start, patchy cumulus bubbling up at 10.30am. Cloud grew thicker around 12 noon with brief shower at 1pm. Then sunny spells and cloudier periods. Another shower just after nightfall then clear. Cloud moved in after 2am with another shower. Early sunshine gave way to moderate showers around 9.45am.
This month marks the 60th anniversary of the Clean Air Act, a piece of government legislation prompted in part by the Great Smog of December 1952 that caused between 4,000 and 12,000 premature deaths.
Air quality in the capital has vastly improved since those days of ‘pea souper’ fogs. A study of sunshine in Greenwich and other sites around east London reveals that winter months are, on average, around 18 per cent sunnier today than they were in the same period before the act was implemented in 1956. Though the cause of this is possibly partly because of a decline in winter anticyclones – weather systems that can give weeks of dull, murky conditions – further environmental legislation has helped.
Though the sky is clearer conditions at street level have grown steadily worse in recent years. During the first week of 2016 it was revealed that parts of the capital had already breached annual EU hourly limits for nitrogen dioxide – a pollutant that causes thousands of premature deaths through respiratory problems each year. A study last year showed that nearly 9,500 people die early each year in London because of long-term exposure to air pollution, more than twice as many as previously thought, according to the research.
Although action is being taken to reduce pollution from diesel buses, taxis and lorries the figures reveal that we are once again getting to the level of deaths caused by the Great Smog. The new mayor of London, Sadiq Khan, seems to be taking pollution a lot more seriously than his predecessor with a number of initiatives announced – making London compliant with EU legal limits well before the government’s target of 2025.
However, the mayor has also sent out conflicting messages by saying he backs the expansion of City Airport – you can’t have it both ways. And, if we do leave the EU, what will replace these EU legal limits?
With the current political situation lurching from one disaster to another I fear that the environment will get pushed well down the agenda. The current list of candidates vying to take over from David Cameron as prime minister include ‘dark horse’ Andrea Leadsom, the energy and climate change minister, who has been an ardent supporter of fracking. And on coal she recently sparked controversy in February where she assured the industry the pledged 2025 coal phase-out was just a consultation and encouraged it to suggest what ‘unabated coal’ means.
The many benefits of EU membership got lost in the debate over the last few weeks – improvement in the environment being one of them. It is why, without the beady eye of Brussels keeping watch over us, that we must ensure that the next government stick to their promise of continual improvement to the capital’s air quality.
Winter sunshine totals were falling before we joined the EU. Since 1973 a general upswing is observed. On average there is 18% more sunshine during winter months since we joined the EU compared with the same period before joining the Common Market
A new suburb the “size of Windsor” is being planned for Barking Riverside, the site of the old Barking Power station, according to a report in the Financial Times.
The Barking Riverside site is sandwiched between two sewage works and a power station
Some 10,800 homes are being planned for the 179-hectare site by the housing association London & Quadrant in association with the Greater London Authority. The report states that £70m will be invested in extending the London Overground rail line to the site. But no mention is made on how much will be invested in flood defences.
Nor does it say that the site is sandwiched between sewage works on either side of the river and a power station and the Ford Motor works to the east.
It is part of the Mayor of London’s ambition for a City in the East that also makes no mention of how much money will be invested in flood defences to make these new estates safe.
This 200,000 home masterplan for East London should be music to the ears of anyone struggling to find a place to live in our overcrowded capital.
But unless planners are willing to spend billions on new flood defences it is possible that these new homes will be particularly at risk of flooding should rainfall levels increase with climate change.
The Environment Agency’s Flood Plan map of the Thames illustrates Howard’s comment that “the Thames was so full during this time that no tide was perceptible”
Many of the developments mooted in London Mayor Boris Johnson’s plan for a City in the East are situated on flood plain, according to the Environment Agency.
On reading through the blueprint flood risk isn’t mentioned once.
A report in the Financial Times, citing the plan, says there is much more potential than previously thought to increase housebuilding in east London, the capital’s planning chief estimates. Sites earmarked include the Lea Valley and areas along the Thames beyond Canary Wharf.
‘Thames Riverside’, the term for an area along the north side of the Thames including Barking and Beckton, could host 27,000 homes, while areas on the opposite side of the river could hold 22,000, according to the report. There could be 52,000 more homes in Lea Valley, 30,000 on the Isle of Dogs and 15,000 in Woolwich.
Sir Edward Lister, deputy mayor for policy and planning, believes the capital’s authorities had learned from their experience with the Nine Elms regeneration area, where a statement of intent had galvanised developers.
“We just have to commit and then the developers can move in,” adding that there were “vast” amounts of underused post-industrial sites along the river in east London.
The housing plans also include commercial and industrial buildings, giving potential to create 280,000 jobs, as well as supporting infrastructure such as schools and hospitals. Transport improvements, such as Crossrail and a new London Overground line, would make the developments ‘desirable’. But costs would be dwarfed by any flood defence improvements.
Previously the Environment Agency has outlined a range of options for the future of the Thames Estuary flood defences. None are particularly cheap.
As a minimum, the EA estimates that the cost of maintaining the defences until 2035 will be around £1.5 billion, with an additional £1.8 billion needed to repair and upgrade the defences until 2050. Particular bits of marshland could also be set aside to store tide waters.
The River Lea close to where Luke Howard’s laboratory stood
More ambitiously, the government could fund a new barrier in either Tilbury in Essex or Long Reach in Kent. Such a barrier would be designed to resist the highest surge tides identified by the Met Office’s analysis of how conditions will change this century. The EA estimates a new barrier could cost as much as £7 billion, though that figure could go up if conditions change significantly as the climate changes.
The Agency also say the existing barrier could be converted to include locks, which could open and close more flexibly and extend the life of the defences. The EA report says a decision on a new barrier will have to be made by 2050.
It may turn out that there’s a more pressing reason to spend. The EA says 50 is the maximum number of times the barrier should close each year, and beyond that, the barrier could start to fail.
How high is the likelihood of flooding in this part of London? A look back through history shows the geography of the Lea Valley has made the area prone to inundations for hundreds of years.
The Environment Agency’s Flood Map for Planning shows the flood zone risk of the area. And endorses Howard’s account that the river Lea was ‘a mile wide’ at its peak
In January 1809 the lower River Lea burst its banks in several places following a deluge that dumped two inches of rain in the space of 24 hours. The rain abruptly ended a snowy cold spell that had begun over a month before in the middle of December. From Luke Howard’sreadings it is likely that up to half a metre of snow had fallen in the previous weeks in the upper parts of the surrounding countryside with only slight thawing. With the frozen ground unable to absorb any of the rapidly melting snow and rainfall the amount of water flowing downstream must have been immense. Howard takes up the story…
“The River Lea continued rising the whole of the 26th… The various channels by which it intersects this part of the country were united in one current above a mile in width which flowed with great impetuosity and did much damage.”
Howard, his chemical factory located on the banks of the river Lea close to what is now Bow flyover, wrote at length about the event, his account replacing the usual brief notes about daily weather in his book The Climate of London.
He talks of embanked pasture land being “filled to the depth of eight or nine feet” and people driven to their upper rooms relieved by boats plying under the windows.
“The Thames was so full during this time that no tide was perceptible.” It took until February 23rd for things to return to normal.
Miraculously no lives were lost in the flood and cattle “by great exertions” were saved by being kept in their stalls. Howard, saying that the flood could have been far worse, believed a neap tide, strong westerly winds urging water down the Thames and mild weather helped avert a tragedy.
Howard’s statistics of the previous months show that the second half of 1808 were wetter than average – though not especially so. And nothing like the rainfall this area recorded during the winter of 2013/14. From December 1st until February 8th 1809 Howard recorded 130mm of rain, which is about 100mm less than what was recorded during 2013/14.
This fact alone shows just how much the nature of the river has changed in the last 200-odd years thanks to spending on flood defences.
Work to improve the defences was prompted 67 years ago when similar catastrophic flooding came with the thaw that ended the severe winter of 1947, one of the coldest winters in history and an episode remarkably similar to what Howard recorded in 1809.
The Lea Valley, along with many parts of the country, saw some of its worst flooding in a generation. The river burst its banks at several points bringing misery to surrounding communities. Valleys turned into lakes in 40 counties and East Anglia’s fens were a sandbagged inland sea. More than 100,000 properties were damaged and, then as now, heroic battles were fought by the military to keep water-pumping plants and power stations dry.
A marker of that flood, together with a history of flood defences, can be found here. There is also British Pathe footage of another flood between 1910 and 1919 here .
Spillers Millennium Mill was repainted 25 years ago especially for the concert. It now provides the backdrop for the London Triathlon across from the ExCeL centre
The River Lea Flood Relief Channel, that flows between Ware, Herts, and Stratford, took almost three decades to complete. The channel incorporates existing watercourses, lakes and new channels. Since it was completed in 1976, there have been no major flood events in the Lea Valley, although there have been three occasions when the river system was full virtually to its capacity: in 1987, 1993 and 2000. Since its completion, the level of protection afforded by the structure has declined, so that in some areas it offers 2 per cent protection, and in some, only 5 per cent protection. The EA published a strategic environmental assessment in 2008, which looked at ways to maintain the flood defences in the Lea Valley.
In summing up its ambitions for a new development the Greater London Authority says it is trying to “overturn the historic perception of the east being seen as apart from London, rather than as a part of London”.
Jim Ward, a director of research at property consultancy Savills, said the challenge was “building something that makes people want to live and work there”, he said. “You need to build more than homes, you need to build a place.”
Boris’s record of late has not been good: an estuary airport to replace Heathrow has been dismissed as pie in the sky while his promise for a 24-hour Tube was made without first consulting unions that it was possible.
London’s safety from flooding is an altogether different proposition, both for old and new developments. Boris really needs to get London’s flood defences right before any brick is laid on these desperately-needed new developments.
The final month of autumn was most notable for its warmth and lack of sunshine.
Rainy days were common through November. This system brought 5.6mm
The November mean was 10.5C, the third warmest on record back to 1797. Only 2011 and 1994 were warmer.
Just 31.7 hours of sunshine were recorded in this area: 54% of average, the dullest November for 47 years, and 9th dullest in the series going back to 1881
Rainfall was more run-of-the-mill: 64.3mm fell during the month: that’s 109% of average.
The warmest day occurred on the 6th with 17.2C recorded. The first air frosts of autumn were recorded. The lowest temperature occurred on the 21st when the mercury fell to -4.1C.
The wettest day was on the 3rd when 7.5mm of rain fell. There were only three completely dry days during the month – a real problem for anyone who works outside.
The beginning of the month was foggy
The sunniest days were on 21st and 22nd when four hours of sunshine were recorded.
What has December got in store weatherwise? The models today (December 1st) suggest the beginning of winter will be held at bay with most model output keeping the Atlantic in control of the weather – persistent high pressure to the SW, south and SE and a strong jet stream funneled between this high pressure zone and low pressure to the north and NW.
Winds throughout the first 15 days will be blowing from between SW and NW.
Because of the exceptionally mild November I wonder how accurate my long range method will be in estimating December – but in the interests of consistency I’ll have a crack anyway.
A mean of about 5.1C with 70mm of rain, on the wetter side of average and with average to slightly below sunshine. The highest probability is for rather cold at 50% probability. Average 25% and rather mild, suggested in my winter forecast, comes in at 25% probability.
My November outlook for temperature was way off. I predicted a mean of about 9C, rather mild, but the result was 10.5C, very mild. This chance showed at just 6% probability.
Here follows the full weather diary for November. To view full stats follow this link:http://1drv.ms/1kiTuzv
1st Foggy start, lifted to brief sunny spells early afternoon before mist thickened up again and saw Wanstead Flats’ fireworks cancelled
2nd Foggy start. This cleared earlier than yesterday but sunshine was weak
3rd Cloudy start though turned brighter at 10.30am. Spots of rain at 5.30pm then cloud and mild. Rain at first light
4th Rain to start then briefly brighter
5th Cloudy then rain from 2.30pm to 5.30pm. Mild and damp overnight
6th Short burst of rain at 9am then more at 9.45am. Further short bursts of rain but then mostly cloudy
7th Light rain to start, this grew heavier through the morning with quite gusty winds – the first of the autumn. Heavier showers earlier afternoon before the rain cleared at dusk
8th Cloudy with only brief brightness. A light shower in the evening
9th Cloudy through most of the day and very breezy. F6 at Walkie Talkie
10th Cloudy to start and very breezy. Spots of rain at 2pm
11th Cloudy through the day and breezy
12th Sunny start though cloud tended to fill in as breeze picked up from ‘Abigail’
13th Sunny start , gradually clouding over with some sharp gusty showers and a heavy one at 2pm
14th Light rain, becoming heavier though turning patchy around noon. Heavier again at 2pm. Petering out in the evening
15th Bright blustery start, the wind continuing through the day
16th Cloudy start with some initial brightness, then cloudy. Rain when we turned up at 8.45, heaviest at 10.45pm
17th Cloudy up until 1pm when it started to rain. Breeze began to pick up with gusty evening – 33.6mph was strongest gust since St Jude storm – wind moderated after 10pm but remained breezy
18th Sunny, bright start though gradually clouded over as breeze picked up. Some squally showers around, mostly south of the river with rain lashing off side of buildings
19th Cloudy start with light rain spreading in at 10am. Outbreaks of light rain until lunchtime then a heavier shower at 3pm. Then overcast and cooler
20th Cloudy start – this cleared just before 1pm to give sunny spells. NW’ly set in through the day with ever cooling air. Sleet falling at 7am
21st Cloudy with heavy burst of sleety rain at obs time. Sky quickly broke to sunny spells but a very cold wind. A cold night
22nd Sunny and sub zero to start after heavy overnight frost. Sunny spells through the day, the frost returning at 2.50am
23rd Sunny, frosty start with some alto cumulus. Cloud grew thicker with rain before midnight that was light through the early hours
24th Cloudy start but with light rain spreading in from 11.30am then stopping and staying cloudy. More rain overnight
25th Light rain to start, stopping at 9.40am then cloudy. Temp dropped through the day with sunny spells
26th Sunny start then turned more cloudy at 11am
27th Cloudy start. Some warm sunshine late morning then turned cloudier with strong gusty squall at 7.30pm. Clear spells overnight that led to ground frost
28th Sunny start, clouding over at 10.30am before light rain spread at 2pm and then gusty winds after dark
29th Cloudy and breezy most of the day thanks to Clodagh
30th Cloudy and breezy with occassonal drizzle
At the beginning of May I had a look at the March and April stats to try to decipher what the coming summer would be like. The results still suggest that summer will be a mixed bag weather-wise with only brief hot spells interspersed with humid thundery breakdowns and cool, cloudy and showery regimes.
The third warmest March-April period since 1799 possibly prompted some weather ‘experts’ to claim that we’re heading for a hot summer. But converse to what the Daily Express told us in April I cannot see any signs of a ‘hottest summer ever’. And it should be remembered that this rag also warned us that the past winter would see ‘100 days of snow’. In the event I think 100 days of rain was probably more true, and I would like to point out at this juncture that my own winter forecast was hopelessly out, along with…
May 2014 continued this year’s theme of being milder than normal; the mean temperature of 13.9C was 0.9C above average, making it the 28th warmest May since 1797.
May was wetter than average, ending the dry theme of March and April. 71mm of rain fell over the 31 days – that’s 139 per cent of average.
The month wasn’t a complete washout with some very warm days during the third week, topped off with long sunny spells. The warmest day was the 19th when 26.7C was reached – the first ^80F temperature of the year – with 9 hours of sunshine. This followed the sunniest day on 18th when 14 hours of sunshine nudged the thermometer to 25.2C.
Of note this month was the number of thunderstorms with four incidents of daily thunder – one more than what we’d expect during a month in high summer. The most notable day of thunder was on the 24th when the temperature dropped over 6C in an afternoon shower.
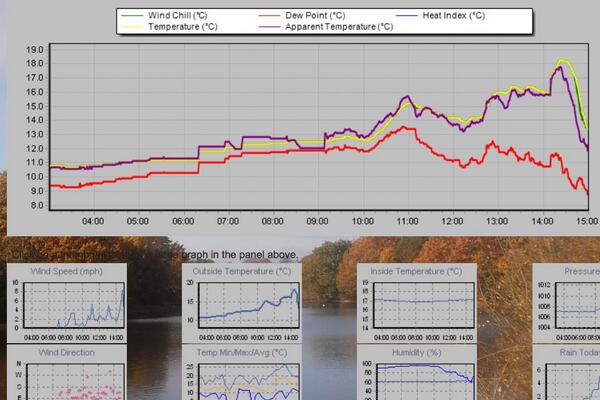
This screen grab shows the thunderstorm at 4pm on 24th that saw the temperature fall nearly 6C in a matter of minutes
May saw just 157.3 hours of sun, 87 per cent of average, making it the dullest for 10 years
this image shows the storm squall on May 24th that brought a near-6C fall in temperature in minutes
and the 22nd dullest since 1881. Indeed May was on sunnier than March by 4 hours.
Some nights were chilly when the sky cleared but there was no air frost and only two ground frosts, on the 2nd and 3rd.
The mean temperature of 10.7C makes 2013 0.5C colder than the 1981-2010 average. And makes the year 46th warmest in the series going back to 1881.
Rainfall of 554.9mm is 92% of average for a year in this area, making it the 68th wettest in the series back to 1888. Some areas of the British Isles have been considerable wetter – this just reflects how variable rainfall can be.
Though the year appears fairly average it masks some notable events…
A couple of notable falls of snow were observed in January and February
January saw a couple of notable falls of snow, the first of which arrived on the 18th. By the morning of the 21st there was 13cm lying.
February saw a further snowy spell with 5cm falling on the 10th – but this only lasted a couple of days.
The mean temperature for March of 3.6C made it the coldest since 1892, the 3rd coldest in the series since 1881.
After a cool and dry spring and early summer July surprisingly turned out to be the warmest since 2006 – the mean temperature of 20.7C being the third warmest in the series going back to 1881. The warmest day of the year occurred on 22nd when 34C was recorded. This was followed by a very potent thunderstorm in the early hours of 23rd.
Autumn overlooking The Temple in Wanstead Park
An average August and September saw a couple of notable rainfall events with 32.8mm on 24/8 and 32.6mm on 13/9 being the the 27th and 28th highest 24hr totals in a series going back to 1961. In the August event Maldon in Essex saw in excess of 100mm leading to flooding. What made it more noticeable is that these events occurred during dry spells.
The end of October saw the St Jude storm blast through Wanstead. The strength of the gusts saw the demise of a few mature limes on Christchurch Green as well as trees in Wanstead Park.

 I’ve read about Iain’s findings in the Royal Meteorological Society‘s journal Weather but to find one of these surviving patches myself enabled me to empathise just why he and others find the task of mapping and measuring them fascinating, a sort of first-hand insight into how the UK’s climate varies from year to year.


You must be logged in to post a comment.