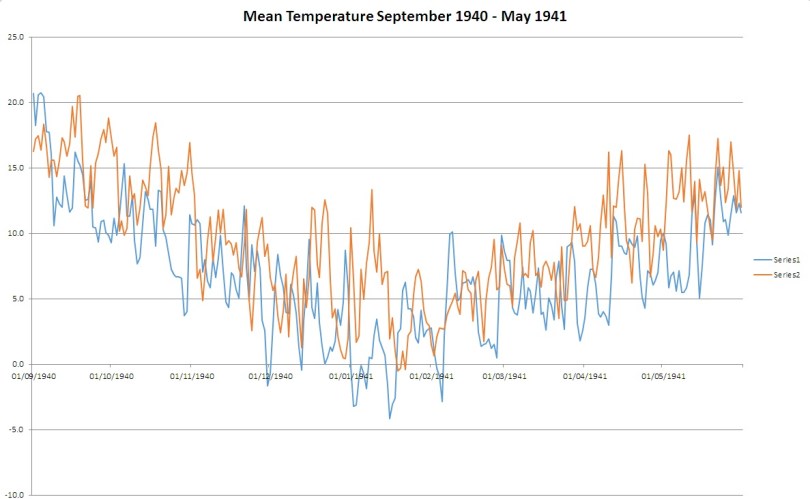
This graph shows how much colder the weather was at the time of the Blitz compared with the period September 2014 – May 2015
This graph shows how much colder the weather was at the time of the Blitz compared with the period September 2014 – May 2015


